An Ultimate Guide to UX Metrics & KPIs to Grow Your Business
Este contenido aún no ha sido traducido al Español. Te mostraremos la versión en inglés a continuación.
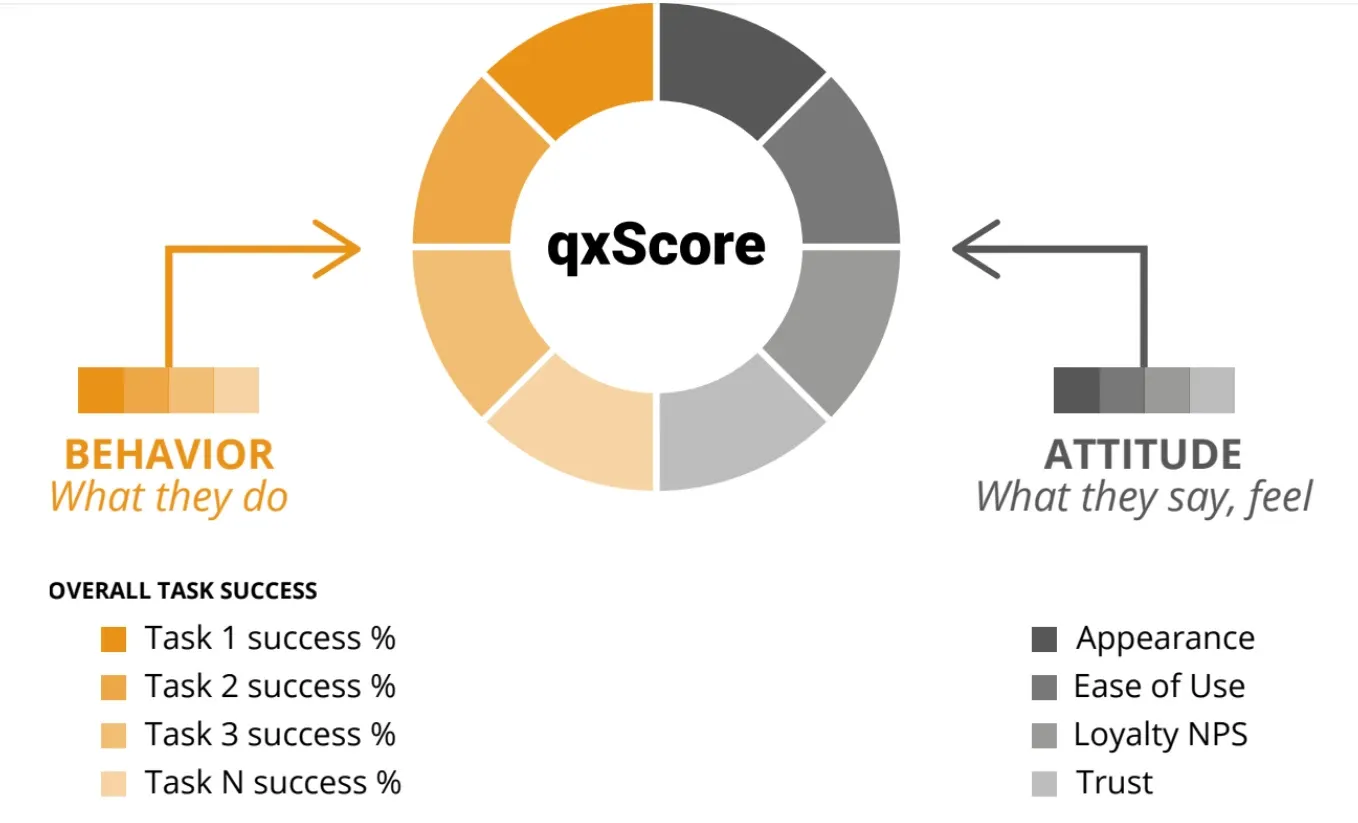
Image from IXD@Pratt
One of the most important things you should be doing when creating any product is keeping a close eye on the UX (user experience) and KPIs (key performance indicators). However, these are difficult to track as they're not hard and fast numbers, like of data involved in production.
You need to track these metrics, but you'll need to find different ways of doing so. Here's how to measure these metrics and get a better understanding of the performance of your product, so you can get the best from it.
Editor’s Note: This post is highly recommended to those who work on improving user experiences, especially product designers and UX designers. Let’s get started!
Why Track UX Metrics And KPIs?
Before you even get into tracking UX and KPI metrics, you need to understand just why you need to do so. Why are they so important?
The most obvious answer is that user experience is important when it comes to the design of any product. You'll want it to be a success, and that success will hinge on whether the average user is getting what they want from it. As such, the UX as a whole should be at the front of your mind throughout the entire design process.
You'll want to know if your product is meeting the needs of your customers and whether they're getting what they want from it. Tracking this through the design and the release of your product will tell you several important things. For example, you'll see where any improvements need to be made, and you can make them quickly as you can react to feedback in real-time.
You'll also have that information ready for when you make new products, as that will let you know what customers are looking for, and you'll be able to make better decisions right off the bat.
As well as this, tracking these metrics means that you'll be able to increase customer satisfaction across the board. If you're tracking the metrics, you can react and make changes much faster. Customers will see that you're doing this. When they see that, they feel they're being listened to and they'll be more inclined to use your products in the future.
“Customer satisfaction is so important when it comes to the success of your product,” says Jason Miles, a marketing blogger at Write My X and 1 Day 2 Write. “As such, tracking metrics should be a part of the whole customer care experience they have with you.”
Types Of UX Metrics that Experts Use

Image from Sematext
You've seen why tracking these UX metrics is so important, so now you need to know what metrics you actually need to be tracking. What is it that you should be paying attention to?
The first thing you need to know is that there are two kinds of metrics that you should be tracking:
-
Qualitative data
This includes all kinds of subjective data. That will include things like customer sentiment and loyalty to your company, usability of your product, customer satisfaction, and other similar data.
-
Quantitative data
This will include that can be measured, including any numbers, ratios, and so on.
When tracking UX data, the challenge is that so many of them are qualitative. That can make the process more difficult, as it has to be scrutinized to ensure that you're getting the right data back from it. This is a longer process than looking at quantitative data, as this is easily interpreted.
If you know what you're looking for though, it can be easier than you'd think at first glance. Here are some of the types of metrics that you'll want to measure.
1. Net Promoter Score (NPS)
This is potentially the most important metric that you need to be tracking, when it comes to UX. It measures how likely a user would be to recommend your product to someone else. The higher this score is, the more likely it is that your product is solving their problems and is something they will want to tell others about.
You'll get this metric by asking customers to score their experience on a scale of one to ten. Once you have that data, you can sort the customers into three groups:
2. Promoters
These customers will score at a 9 or 10. They're the most loyal customers you have, and very much get what they want from your product.
3. Passives
These customers score at a 7 or 8. They're satisfied with the product that you're offering, but they're not inclined to recommend it to others.
4. Detractors
These are the rest of your customers, who score between 0 and 6. They're unhappy with parts of your product, and could even detract others from buying it.
5. System Usability Scale (SUS)
This is used when it comes to digital products and has actually been around since the 80s. It's still considered to be one of the best ways to measure the user experience when it comes to these kinds of products.
The scale comprises 10 questions that you'll ask your customers, in order to measure their satisfaction with the product. That gives you a usability score that you can use to improve and make changes to the product as a whole.
6. Customer Satisfaction Score (CSAT)
This is how you'll measure how happy or unhappy your customers are, overall, with your product. You can also use it to measure satisfaction with a certain feature of your product.
This can be measured in a couple of different ways. For example, you can ask customers a series of yes or no questions, to get an idea of whether they got what they needed. For example, you can ask if the product helped them complete a certain task. This gives you a percentage score.
You can also give the customer a scale that they can use, to describe their experience. In this example, you may ask them to score their satisfaction with a certain feature on that scale. That will give you an overall aggregate score.
7. Time-on-Task
As the name implies, this metric helps you measure how long it takes a user to complete a specific task. This is something that you want to be tracking, as it lets you know just how efficient your product is. That's especially important to track if you're looking to make your product to help customers with productivity or performance.
This is something that you can actually track without any input from your customers. Instead, you'll get the data from analytics tools. These will give you the results that you need to make improvements to your products.
8. Customer Effort Score (CES)
This is a metric you'll use to measure how easy it is for a customer to complete a task using your product. Again, you'll get the data for it by talking to customers directly for their input. You'll need to give them a scale that they can answer with.
For example, you'll ask them how easy it was to use a certain feature. They'll then give you a score between 1 and 10, with 1 being “very difficult” and 10 being “very easy”.
9. Error Rate
“You'll want to ensure you're measuring the error rate of your product,” says Kelly Harris, a business writer at Origin Writings and Brit Student. “This will point out any crucial issues with the product that could put customers off using it.” The error rate is how often a product actually prevents someone from completing a task.
It's important to know that you're not likely to be able to keep this rate at 0%, but you should aim to keep it as low as possible. If you're getting high scores, that's a sign to you that there's a significant usability issue that needs to be addressed, and quickly.
10. Completion Rate
This rate works in a similar way, as the rate will measure how often a user is able to complete a task using your product. It's what you should be monitoring as it can tell you if there's a broader problem that you need to address.
For example, if you have typically high completion rates, but the rate suddenly drops, that's a sign that there's a bug in the programming or a usability issue. This could happen after a new release or update. If you're on top of this metric, then you can address problems quickly and keep overall satisfaction rates high.
11. Engagement
This is another metric that lets you know if customers are getting what they need from your product, and are enjoying using it. You can use this to get an idea of your overall engagement.
There are several metrics that actually combine to show you the engagement on your product. The exact metrics you'll use will depend on the product in question, but they can include:
- How long users use the product for
- How many page views you have
- How much scrolling users do
- If users are engaging with content
- How many tasks users complete using the product
You'll need to pick the metrics that you'll use when measuring engagement for your product, but the above examples are a good way of measuring this.
12. Conversion Rates
Finally, you'll want to track all the customers that convert. That means those who complete forms, buy your product, sign up for email updates, and so on.
It's an important metric to watch, as decisions you make in design can both improve and detract from your conversion rates. If there's a change to the rates, you can get a good idea of the success of your latest decision.
How To Track UX Metrics and KPIs: Tips & Tools
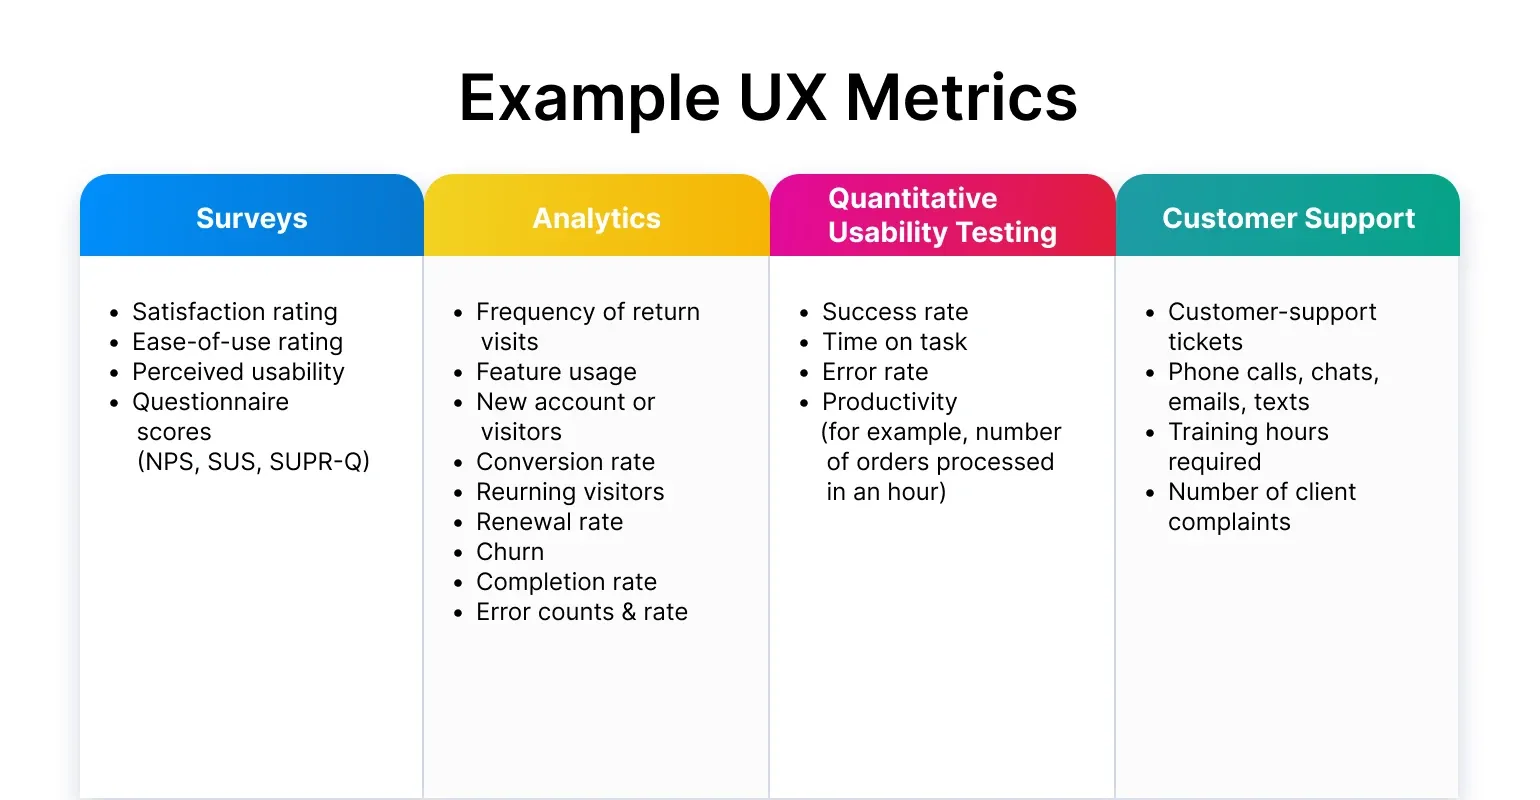
Image from Arounda
Now you know what metrics you want to measure, you'll need to look into how to track them. Here's how you'll watch them.
1. Define your benchmarks
Firstly, you'll need to know where the benchmarks are for the metrics you're tracking. That gives you a frame of reference, so you can see whether you're exceeding expectations, or need to make improvements. For example, you can determine how long it takes to complete a task right now, so you can see if that improves over time.
2. Set your goals and KPIs
You need to have an idea of what you're hoping to achieve when you set your metrics. That gives you a standard to work towards. Your KPIs will be the indicators that you're working towards that goal and are on the right track.
3. Measure your metrics
Now you'll need a tool to measure these metrics, so you can tell if you're hitting your KPIs. There are several different online tools that can be used here. Google Analytics is a popular choice, as it's free and can easily track users. Hotjar is designed well for qualitative metric measurement. You can also use Baremetrics, as these help with quantitative data.
4. Report on your metrics
Measuring your metrics means that you'll have the data that you need to report back to your stakeholders. It allows you to show that you're making progress, and you can even make predictions on when you'll reach your outcomes.
Typically, you'll focus on four things when reporting on your metrics. These are your starting point, or benchmark, or target KPI, performance against that KPI, and your desired goal. That makes it very clear where you are right now, and where you intend to be in the near future.
5. Act on your metrics
Once you have all the metrics in place and are measuring them, you'll want to start acting on any that need your input. You should create a plan to act on KPIs, should you need to. What will you do if a certain KPI isn't met?
These metrics are meant to give you a clear indicator of where improvements need to be made, so make sure you're paying attention to them.
Conclusion
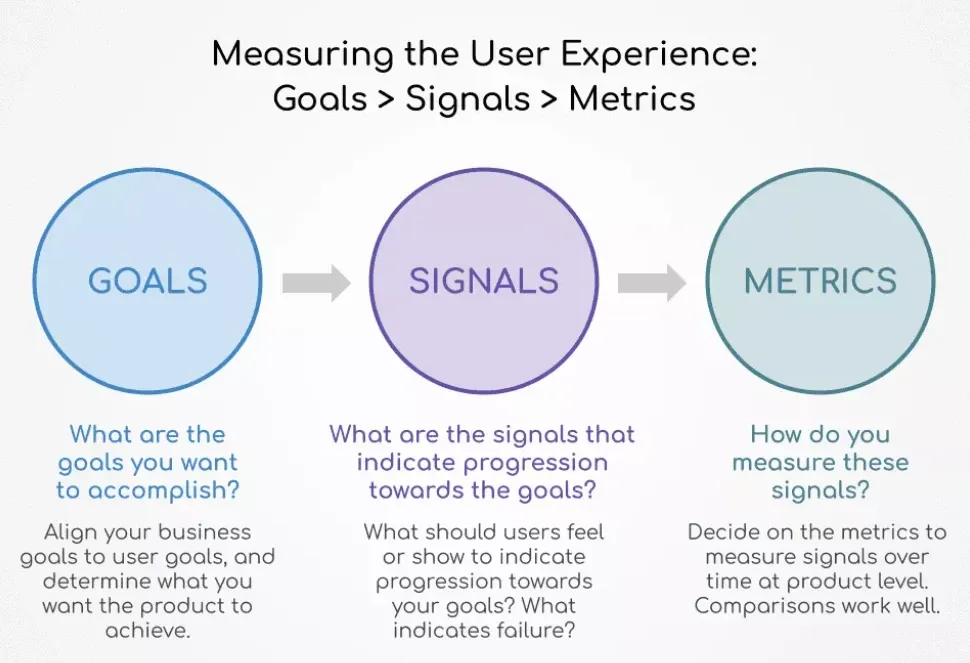
Image from Netizen Experience
Now you have an overview of how to track important UX metrics when you're designing your product. With this data, you're able to keep a close eye on how your product is working, where the pain points are for your customers, and what you can do to improve it.
Artículos relacionados